biotect
Designer
.
CONTINUED FROM PREVIOUS POST
**************************************************
21. Making Sense of the Data Points
**************************************************
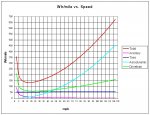
Now there is no question that the KW per hour requirement is accelerating, meaning that the rate of increase is itself increasing. This is already patently evident in the chart that the first web-calculator produces, where doubling the speed from 40 kph to 80 kph more than triples the per-hour power requirement, from approximately 42.7 KW to 131.5 KW:

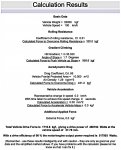
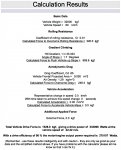
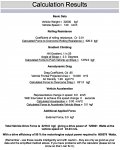
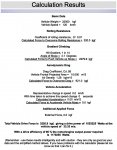
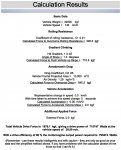
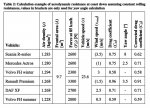
But once we calculate for a given distance, the increased speed of travel almost "cancels out" this non-linearity. The following is a spreadsheet that demonstrates how when we calculated the Total Power required for 128.6 km, driving this distance at 90 kph, 100 kph, 110 kph, and 120 kph (without headwind), a linear increase in speed by 10 kph increments, produces only a comparatively moderate non-linear increase in the power requirement -- in increments separated by 32.3 KW to 38.46 KW:

Notice that I didn't bother doing the Total Power calculations for the first web calculator, at http://ecomodder.com/forum/tool-aero-rolling-resistance.php , because its results vary systematically in any case with the results produced by Iain's equations and the second web calculator. The results produced by the second web calculator -- when there is no headwind -- are so close to those produced by Iain's equations, that they do seem more reliable, and hence worth developing further.
Yes, there is still a non-linear increase in the Total Power requirement. But nothing like the non-linearity of the increase in the Per-Hour power requirement. Here is a more complete set of values of the Total Power requirement for 128.6 km generated using the second web-calculator, running from 50 kph to 120 kph -- again see http://buggies.builtforfun.co.uk/Calculator/analyse-metric.php :
Change in total power required for 50 kph versus 60 kph: 339.61 KW versus 358.09 KW, a change of 18.48 KW, and an increase of 5.44 % (travel time at 60 kph: 2.143 hours)
Change in total power required for 60 kph versus 70 kph: 358.09 KW versus 379.87 KW, a change of 21.78 KW, and an increase of 6.08 % (travel time at 70 kph: 1.837 hours)
Change in total power required for 70 kph versus 80 kph: 379.87 KW versus 405.22 KW, a change of 25.35 KW, and an increase of 6.67 % (travel time at 80 kph: 1.608 hours)
Change in total power required for 80 kph versus 90 kph: 405.22 KW versus 433.67 KW, a change of 28.45 KW, and an increase of 7.02 % (travel time at 90 kph: 1.429 hours)
Change in total power required for 90 kph versus 100 kph: 433.67 KW versus 465.5 KW, a change of 31.83 KW, and an increase of 7.33 % (travel time at 100 kph: 1.286 hours)
Change in total power required for 100 kph versus 110 kph: 465.5 KW versus 500.76 KW, a change of 35.26 KW, and an increase of 7.57 % (travel time at 110 kph: 1.169 hours)
Change in total power required for 110 kph versus 120 kph: 500.76 KW versus 539.44 KW, a change of 38.68 KW, and an increase of 7.77 % (travel time at 120 kph: 1.0717 hours)
Remember, to obtain the total power required, one takes the KW figure per hour, and then multiplies that by the travel time, a travel time that becomes progressively shorter. This progressively shorter travel time then in effect "cancels out" the strong non-linear effect that one would expect to see v[SUP]3 [/SUP]produce. One does see that strong non-linearity at the level of the per-hour KW consumption, but not at the level of the KW figure required for a fixed distance.
There is still a non-linear increase in the Total Power requirement, and driving faster does consume more energy per unit distance travelled. I calculated the percentage of increase, because a mere increase in the absolute value of the increment would not by itself necessarily suggest a non-linear increase. Rather, only an increase in the percentage reliably suggests as much. But the increase in the percentage is not quite as dramatic as one might think, and driving 100 kph does not consume double the amount of energy for a given unit of distance travelled as driving 50 kph. Instead, it only consumes about 37.5 % more energy.
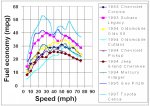
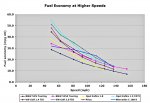
Now strange as this may seem, the percentage changes in efficiency as one increases speed in 10 kph increments listed above, do seem to roughly correspond to empirical test data produced by a study of 74 vehicles. Although the TerraLiner is pure conjecture, and Iain's equations are at best just "approximations" or "abstractions" of reality, the results they produce for the extra power required to overcome air-resistance at higher speeds for a given unit of distance, do seem to correlate with real-world test data. The following two charts summarize the drop in efficiency as the test vehicles increased their speeds in 10 mph increments, from 50 to 60 mph, 60 to 70 mph, and 70 to 80 mph -- see http://www.greencarcongress.com/2013/01/thomas-20130117.html :

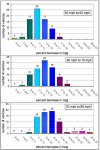
Instead of total Kwh for a fixed distance as per my table above, the measure of efficiency here is mpg, or "miles per gallon". As a measure of efficiency this pretty much amounts to the same thing, even though in an mpg metric the quantity of energy becomes fixed, and distance becomes the variable: mpg means the amount distance achieved (miles) using a fixed quantity of of energy (gallons). The increments are 10 mph instead of 10 kph. But when we divide both the percentage decrease in efficiency and the percentage speed increase in order to get something equivalent for kph, we get similar figures. A decrease in efficiency of 12.4 % for an increase of 10 mph between 50 and 60 mph, for instance, becomes a decrease of of 7.7 % for an increase of 10 kph. 50 mph is roughly 80 kph, and the drop-off in efficiency that Iain's equations suggest would take place between 80 kph and 90 kph is 7.02 %. Or a decrease in efficiency of 15.4 % for an increase of of 10 mph between 70 and 80 mph, becomes a decrease of 9.56 % for an increase of 10 kph.
80 mph is roughly 130 kph, and sure, a loss of efficiency of 9.56 % is more than a loss of 7.7 %. But what concerns me here is the overall pattern, and the character of the curve that gets produced. In this empirical study, between 50 mph and 80 mph fuel efficiency drops on average 13.9 % per increment, or roughly 42 % in total. (Yes, I know it's not quite as simple as that, but here I am only concerned with rough outlines..... ). And between 80 kph and 130 kph (prorating for 120 kph), Iain's equations would suggest a loss of efficiency of roughly 38 % in total. In short, we are very much in the same ballpark.
Here again, if the loss in energy efficiency measured by this empirical test -- due to speeding up and air-resistance -- is somehow "exponential", then that exponential increase is still very subtle, and not dramatic at all. That's the general point that the overall reveals.
**************************************************
22. The extra power required to overcome Air-Resistance at higher speeds for a given unit of distance:v[SUP]3[/SUP] or v[SUP]2[/SUP]??
**************************************************
Put another way, if we are in fact on some kind of v[SUP]3 [/SUP]curve here, we are not yet on the part of v[SUP]3 [/SUP]curve where the slope of the curve has become so steep (closer to vertical), that doubling the speed would require at least doubling the power, for a given unit of distance......
Iain briefly mentioned that air-resistance is a cubic function, v[SUP]3[/SUP], a function that quickly becomes asymptotic. Put graphically, a cubic function looks like this:
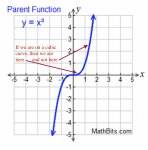
So if, as speed increases, the curve for the Total Power required for a given unit of distance in order to overcome Air-Resistance were a cubic curve, then at 50 to 120 kph we are still very much at the beginning of any such v[SUP]3 [/SUP]curve. Perhaps at speeds above 500 kph or above 1000 kph the curve gets asymptotic; I haven't don't the calculations....:ylsmoke: . But between 50 and 120 kph, the curve for the Total Power required to overcome Air-Resistance for a given unit of distance is still fairly flat and closer to horizontal than vertical.
However, following the insight quoted above in post #2111, I think that when it comes to the energy required per unit of distance, we are actually finding ourselves on a squared, v[SUP]2[/SUP] curve, and not a cubic curve -- see http://www.truck-drivers-money-saving-tips.com/air-resistance.html :
And here too, we would only be at the beginning of a v[SUP]2 [/SUP]curve; either that, or we are on a v[SUP]2 [/SUP]curve that has been appropriately "broadened" by a coefficient:

I could be wrong about this. Unfortunately I have not taken a course in aerodynamics, which in hindsight would have been very useful!! This is getting fairly technical, and answers are not easily available on the web. So if anyone reading this truly, honestly has the necessary engineering background to explain what's going on here mathematically, in a clear, easy-to-understand way, please post!!
By "engineering background" I mean just that: at least a B.A. or an M.A. in transportation engineering specifically, with the necessary course or courses in aerodynamics under one's belt. The mere opinions of laypersons who've tried teaching themselves this stuff are interesting only up to a certain point. Even a structural or civil engineer might not have the requisite knowledge vis-a-vis this, specific area of expertise. Whereas a bona-fide professional transportation engineer could clarify the mathematical side of the question, for instance: v[SUP]2 [/SUP]or v[SUP]3[/SUP], for the curve describing the energy required per unit distance as one speeds up.... And no doubt such an engineer could offer many more insights, and genuine corrections.....:ylsmoke:
This may seem strange, but a course in aerodynamics is not necessarily included in the traditional education of a transportation designer. As a number of students at Art Center explain in the following video, before they took a course in which they were asked to constantly refine their car designs keeping aerodynamic flow model data in mind, they had not studied aerodynamics:
thjakits suggested that I need to work with an automotive engineer who understands such things well, and this is correct. But in addition I like to understand things for myself, which is why I did all the calculations on these pages. What I also need is a course in automotive aerodynamics, and specifically, a course that would include coverage of the comparative fuel-consumption characteristics for ICE vehicles versus hybrids, as Fair and Fslope increase. This will become even more clear in the next post. The "energy efficiency profile" of an electric vehicle is actually quite a bit different than an ICE vehicle, which kind of stands to reason, if you think about it.....
**************************************************
CONTINUED IN NEXT POST
.
CONTINUED FROM PREVIOUS POST
**************************************************
21. Making Sense of the Data Points
**************************************************
Now there is no question that the KW per hour requirement is accelerating, meaning that the rate of increase is itself increasing. This is already patently evident in the chart that the first web-calculator produces, where doubling the speed from 40 kph to 80 kph more than triples the per-hour power requirement, from approximately 42.7 KW to 131.5 KW:

But once we calculate for a given distance, the increased speed of travel almost "cancels out" this non-linearity. The following is a spreadsheet that demonstrates how when we calculated the Total Power required for 128.6 km, driving this distance at 90 kph, 100 kph, 110 kph, and 120 kph (without headwind), a linear increase in speed by 10 kph increments, produces only a comparatively moderate non-linear increase in the power requirement -- in increments separated by 32.3 KW to 38.46 KW:
Notice that I didn't bother doing the Total Power calculations for the first web calculator, at http://ecomodder.com/forum/tool-aero-rolling-resistance.php , because its results vary systematically in any case with the results produced by Iain's equations and the second web calculator. The results produced by the second web calculator -- when there is no headwind -- are so close to those produced by Iain's equations, that they do seem more reliable, and hence worth developing further.
Yes, there is still a non-linear increase in the Total Power requirement. But nothing like the non-linearity of the increase in the Per-Hour power requirement. Here is a more complete set of values of the Total Power requirement for 128.6 km generated using the second web-calculator, running from 50 kph to 120 kph -- again see http://buggies.builtforfun.co.uk/Calculator/analyse-metric.php :
Change in total power required for 50 kph versus 60 kph: 339.61 KW versus 358.09 KW, a change of 18.48 KW, and an increase of 5.44 % (travel time at 60 kph: 2.143 hours)
Change in total power required for 60 kph versus 70 kph: 358.09 KW versus 379.87 KW, a change of 21.78 KW, and an increase of 6.08 % (travel time at 70 kph: 1.837 hours)
Change in total power required for 70 kph versus 80 kph: 379.87 KW versus 405.22 KW, a change of 25.35 KW, and an increase of 6.67 % (travel time at 80 kph: 1.608 hours)
Change in total power required for 80 kph versus 90 kph: 405.22 KW versus 433.67 KW, a change of 28.45 KW, and an increase of 7.02 % (travel time at 90 kph: 1.429 hours)
Change in total power required for 90 kph versus 100 kph: 433.67 KW versus 465.5 KW, a change of 31.83 KW, and an increase of 7.33 % (travel time at 100 kph: 1.286 hours)
Change in total power required for 100 kph versus 110 kph: 465.5 KW versus 500.76 KW, a change of 35.26 KW, and an increase of 7.57 % (travel time at 110 kph: 1.169 hours)
Change in total power required for 110 kph versus 120 kph: 500.76 KW versus 539.44 KW, a change of 38.68 KW, and an increase of 7.77 % (travel time at 120 kph: 1.0717 hours)
Remember, to obtain the total power required, one takes the KW figure per hour, and then multiplies that by the travel time, a travel time that becomes progressively shorter. This progressively shorter travel time then in effect "cancels out" the strong non-linear effect that one would expect to see v[SUP]3 [/SUP]produce. One does see that strong non-linearity at the level of the per-hour KW consumption, but not at the level of the KW figure required for a fixed distance.
There is still a non-linear increase in the Total Power requirement, and driving faster does consume more energy per unit distance travelled. I calculated the percentage of increase, because a mere increase in the absolute value of the increment would not by itself necessarily suggest a non-linear increase. Rather, only an increase in the percentage reliably suggests as much. But the increase in the percentage is not quite as dramatic as one might think, and driving 100 kph does not consume double the amount of energy for a given unit of distance travelled as driving 50 kph. Instead, it only consumes about 37.5 % more energy.
Now strange as this may seem, the percentage changes in efficiency as one increases speed in 10 kph increments listed above, do seem to roughly correspond to empirical test data produced by a study of 74 vehicles. Although the TerraLiner is pure conjecture, and Iain's equations are at best just "approximations" or "abstractions" of reality, the results they produce for the extra power required to overcome air-resistance at higher speeds for a given unit of distance, do seem to correlate with real-world test data. The following two charts summarize the drop in efficiency as the test vehicles increased their speeds in 10 mph increments, from 50 to 60 mph, 60 to 70 mph, and 70 to 80 mph -- see http://www.greencarcongress.com/2013/01/thomas-20130117.html :


Instead of total Kwh for a fixed distance as per my table above, the measure of efficiency here is mpg, or "miles per gallon". As a measure of efficiency this pretty much amounts to the same thing, even though in an mpg metric the quantity of energy becomes fixed, and distance becomes the variable: mpg means the amount distance achieved (miles) using a fixed quantity of of energy (gallons). The increments are 10 mph instead of 10 kph. But when we divide both the percentage decrease in efficiency and the percentage speed increase in order to get something equivalent for kph, we get similar figures. A decrease in efficiency of 12.4 % for an increase of 10 mph between 50 and 60 mph, for instance, becomes a decrease of of 7.7 % for an increase of 10 kph. 50 mph is roughly 80 kph, and the drop-off in efficiency that Iain's equations suggest would take place between 80 kph and 90 kph is 7.02 %. Or a decrease in efficiency of 15.4 % for an increase of of 10 mph between 70 and 80 mph, becomes a decrease of 9.56 % for an increase of 10 kph.
80 mph is roughly 130 kph, and sure, a loss of efficiency of 9.56 % is more than a loss of 7.7 %. But what concerns me here is the overall pattern, and the character of the curve that gets produced. In this empirical study, between 50 mph and 80 mph fuel efficiency drops on average 13.9 % per increment, or roughly 42 % in total. (Yes, I know it's not quite as simple as that, but here I am only concerned with rough outlines.....
Here again, if the loss in energy efficiency measured by this empirical test -- due to speeding up and air-resistance -- is somehow "exponential", then that exponential increase is still very subtle, and not dramatic at all. That's the general point that the overall reveals.
**************************************************
22. The extra power required to overcome Air-Resistance at higher speeds for a given unit of distance:v[SUP]3[/SUP] or v[SUP]2[/SUP]??
**************************************************
Put another way, if we are in fact on some kind of v[SUP]3 [/SUP]curve here, we are not yet on the part of v[SUP]3 [/SUP]curve where the slope of the curve has become so steep (closer to vertical), that doubling the speed would require at least doubling the power, for a given unit of distance......
Iain briefly mentioned that air-resistance is a cubic function, v[SUP]3[/SUP], a function that quickly becomes asymptotic. Put graphically, a cubic function looks like this:

So if, as speed increases, the curve for the Total Power required for a given unit of distance in order to overcome Air-Resistance were a cubic curve, then at 50 to 120 kph we are still very much at the beginning of any such v[SUP]3 [/SUP]curve. Perhaps at speeds above 500 kph or above 1000 kph the curve gets asymptotic; I haven't don't the calculations....:ylsmoke: . But between 50 and 120 kph, the curve for the Total Power required to overcome Air-Resistance for a given unit of distance is still fairly flat and closer to horizontal than vertical.
However, following the insight quoted above in post #2111, I think that when it comes to the energy required per unit of distance, we are actually finding ourselves on a squared, v[SUP]2[/SUP] curve, and not a cubic curve -- see http://www.truck-drivers-money-saving-tips.com/air-resistance.html :
"The power to overcome air resistance increases roughly with the cube of the speed, and thus the energy required per unit distance is roughly proportional to the square of speed."
And here too, we would only be at the beginning of a v[SUP]2 [/SUP]curve; either that, or we are on a v[SUP]2 [/SUP]curve that has been appropriately "broadened" by a coefficient:

I could be wrong about this. Unfortunately I have not taken a course in aerodynamics, which in hindsight would have been very useful!! This is getting fairly technical, and answers are not easily available on the web. So if anyone reading this truly, honestly has the necessary engineering background to explain what's going on here mathematically, in a clear, easy-to-understand way, please post!!
By "engineering background" I mean just that: at least a B.A. or an M.A. in transportation engineering specifically, with the necessary course or courses in aerodynamics under one's belt. The mere opinions of laypersons who've tried teaching themselves this stuff are interesting only up to a certain point. Even a structural or civil engineer might not have the requisite knowledge vis-a-vis this, specific area of expertise. Whereas a bona-fide professional transportation engineer could clarify the mathematical side of the question, for instance: v[SUP]2 [/SUP]or v[SUP]3[/SUP], for the curve describing the energy required per unit distance as one speeds up.... And no doubt such an engineer could offer many more insights, and genuine corrections.....:ylsmoke:
This may seem strange, but a course in aerodynamics is not necessarily included in the traditional education of a transportation designer. As a number of students at Art Center explain in the following video, before they took a course in which they were asked to constantly refine their car designs keeping aerodynamic flow model data in mind, they had not studied aerodynamics:
thjakits suggested that I need to work with an automotive engineer who understands such things well, and this is correct. But in addition I like to understand things for myself, which is why I did all the calculations on these pages. What I also need is a course in automotive aerodynamics, and specifically, a course that would include coverage of the comparative fuel-consumption characteristics for ICE vehicles versus hybrids, as Fair and Fslope increase. This will become even more clear in the next post. The "energy efficiency profile" of an electric vehicle is actually quite a bit different than an ICE vehicle, which kind of stands to reason, if you think about it.....
**************************************************
CONTINUED IN NEXT POST
.
Last edited:


