North East Backcountry Discovery Route
Part Five of Six
Unfortunately, for several reasons, it looks like I will be the only person to complete the entire NEBDR, and the details that surround the group breaking apart don't really matter at this point. I'll simply state that a member of the group with presumably good intentions began to invite several other vehicles to join an in-progress adventure and I was the first to peer into the future and call it for what it was - a failed plan. If we meet on the trail someday and are sitting around a fire sharing stories, I'd be happy to walk you through step-by-step and identify where things began to fall apart, and more importantly, why.

So here I was, alone with 350 miles to complete, and time was no longer a consideration. I decided to slow the pace down significantly, stop more, walk around the area or hike a short trail, listen to the river and the trees, feel the cool crisp autumn air sting my face, and watch a fallen leaf carried away by the swift current. This is what I came for.

Since I frequently travel alone in areas without cellular service I carry an assortment of recovery options. I carry four Maxtrax MKII traction boards. Maxtrax are lightweight, durable traction boards (also known as recovery boards) invented in Australia in 2005, made from UV-stabilized, engineering-grade reinforced nylon. Primarily designed for off-road vehicle recovery, they feature aggressive cleats for grip, ramped ends for easy tire access, built-in handles, and shovel-like undersides. They're compact (13 inches wide and 45 inches long), stackable, and weigh around 5-6 lbs each. While their core purpose is vehicle extraction, Maxtrax are versatile tools for off-roaders, campers, and adventurers. Here are some of their uses: (1) Vehicle Recovery - Place under spinning tires to provide instant traction and allow the vehicle to "climb" out by idling forward. (2) Terrain Bridging and Obstacle Navigation - Stack or link boards to create temporary ramps, bridges, or steps over gaps, ledges, or uneven ground. (3) Camping and Leveling - Use flat or stacked to create stable platforms for uneven parking.

The Rocky Gorge thundered below as she stepped into the frame, its white water swallowing every sound. Sixty feet away across the churning mist, she looked straight at me and asked without a word:
May I be in it?
I nodded, lifted my hand in a clear thumbs-up, and watched her shoulders ease with understanding. Then I opened my palm, fingers pressed together, holding it steady in the air like a silent command -
stay perfectly still - and she did, her soft body poised on the jagged rocks as the shutter stretched seconds into silk. When the final frame clicked shut, I gave her another thumbs-up, and she answered with a heart-stopping smile before I slipped away down the trail, leaving behind only the echo of our wordless collaboration and a photograph that holds the moment we both decided to make something beautiful together.

Near the end of section six of the NEBDR, I tackled the forbidding ascent of Mount Washington State Park in my sturdy 4.5-ton adventure vehicle. At the base around 1,500 feet, conditions felt deceptively warm and serene, with balmy breezes and golden leaves setting a welcoming tone for the journey ahead. My 6.4L HEMI engine delivered a deep, resonant rumble, steadily powering me through the eight-mile unrelenting climb to 6,288 feet, where each twist and turn built a rush of adrenaline - equal parts fear and excitement. As I gained elevation, the scenery unfolded in surreal splendor: distant mountains veiled in hazy blue, with wispy clouds drifting by and the sky taking on a vast, otherworldly quality, as if I'd entered a different realm. Then, transitioning into the stark alpine zone above about 4,500 feet, where trees thinned into resilient shrubs amid exposed granite, the captured photo gazes up the winding road toward a sharp curve flanked by a sheer rocky cliff that plunges into seeming oblivion, heightening the sense of perilous adventure. Yet, upon reaching the summit, the calm below surrendered to biting cold and relentless gale-force winds, a raw reminder to bundle up against the mountain's unpredictable fury.

Mount Washington, the highest peak in the Northeastern United States at 6,288 feet, has a rich history dating back to its first recorded European ascent in 1642. Named after George Washington in the late 18th century, it became a tourist destination in the 19th century with the establishment of the Crawford Path in 1819 (the oldest continuously maintained hiking trail in the U.S.) and the
Mount Washington Auto Road in 1861. Scientifically, the mountain is renowned for its extreme weather due to converging storm tracks, featuring an alpine tundra climate with a treeline around 4,400 feet and average snowfall of 280 inches; it also hosts the
Mount Washington Observatory since 1932 for subarctic research. It holds notable records, including the Northern and Western Hemisphere's highest measured surface wind speed of 231 mph in 1934, hurricane-force gusts on over 100 days per year, a record low temperature of -50°F in 1885, and a wind chill of -108°F in 2023. Visitors should heed stark warnings about the mountain's dangers, as more than 161 fatalities have occurred since records began in 1849, with falls being the most common cause, often exacerbated by rapidly changing conditions, poor preparation, and hypothermia.

At 6,288 feet atop Mount Washington, my photo of my AEV Prospector and Four Wheel Camper stands out sharply against the stark backdrop, the lighting dramatically different due to the thinner atmosphere, about 20% less dense than at sea level, which reduces haze and scattering, resulting in deeper blues, crisper shadows, heightened contrast, and more saturated colors. With less dust, moisture, and pollutants in the air, the light feels cleaner and more intense, giving the scene a vivid, almost surreal clarity that makes the image appear strikingly luminous and hyper-real compared to shots taken at lower elevations.

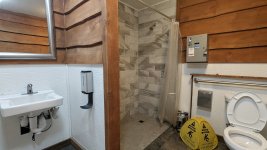
As I drove north and finished section six, I rolled into Gorham, NH. First, I located a Ram dealer for an oil change, then a side-by-side (SxS) rental shop that also offered showers for $0.25 per minute. It had been weeks since I'd enjoyed a long, warm shower, so I took full advantage. Finding showers on the road can be challenging in remote areas, where your main options are campgrounds or truck stops (if you're near an interstate). In towns, check YMCAs, gyms, or other unexpected spots - I've showered at a hair salon in Arizona, a public pool in Texas, and now an SxS rental shop in New Hampshire.
Section seven of the NEBDR is 176-miles long and becomes more rugged and remote as I press on towards the Canadian border, opportunities for food and fuel are becoming even more sparse now. It begins in Gorham, New Hampshire, heads east through a notch in the mountains crossing into Maine, turns south and east for a bit, and then shoots north ending in Rangeley, Maine.

Rangeley, Maine - I had been there decades ago for military training. It was in February, and the snow in the mountains was so deep we had to wear snowshoes. The average daytime temperature was in the single digits, and every night was below zero, with one night recorded as the nation's low at -30°F. This is the first time I had thought about that location in a long time, and as I drove closer, I could feel those deeply rooted, fear-based memories slowly surfacing.
At first, I tried to distract myself with tasks, such as listening to a podcast or checking my navigation. But as darkness fell and the distance between me and that place closed, the gates in my mind opened, and a flood of memories and emotions overwhelmed me. Time spent in the Resistance Training Laboratory produced some of the highest recorded levels of cortisol ever documented in humans. We spent nearly a week in that phase alone. I’m talking about levels higher than someone undergoing major surgery or a skydiver making their first jump, but even worse. We were starved, exposed to sleep deprivation, forced into stress positions, endured torture in the form of soft-cell and hard-cell interrogations, sensory deprivation, sexual humiliation, mock executions, etc. The Officer In Charge of the school had been a POW in Vietnam for seven years and was permanently disfigured.
Some students experienced mild environmental injuries, such as frostbite, while others suffered physical injuries like sprains or broken bones. One student, years before I attended, even broke his back; a close friend,
Larry had his jaw broken and was removed from training. Over the years, there were a few deaths - heart attacks and even suffocation, we were young healthy men in our prime. Psychological injuries were also common, including dissociation, sensory distortions, and severe psychological stress. I suspect we all experienced different levels of these effects.
One thing is for certain: every man is a changed man after completing that training.
There's no discharge in the war!

